Salon Complies List of the Top Ten Least Integrated Cities
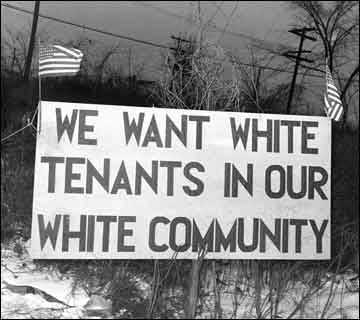
The rankings are based on a dissimilarity index, a measure used by social scientists to gauge residential segregation. A score of one indicates perfect integration while 100 indicates complete segregation.
- Los Angeles
Segregation level: 67.84
Blacks and Latinos and more likely to live near one another, but their separation from white neighborhoods persists. Segregation between Asians and whites are about 20 points lower than that of blacks, mostly due to the temporary segregation of immigrants living in ethnic districts.
2. Philadelphia
Segregation level: 68.41
According to census data, the level of segregation between blacks and whites is declining at a slower rate than during the 1990s.
Just as white city-dwellers fled neighborhoods when black families arrived in postwar years, suburban whites are fleeing to exurbs as blacks and Latinos move to older suburbs.
3. Cincinnati
Segregation level: 69.42
Racial residential segregation intensified as whites left Cincinnati from the 1950s-70s. Now, blacks remain concentrated in the center city, excluded from white neighborhoods and displaced by large-scale urban renewal projects.
4. St. Louis
Segregation level: 72.3
East St. Louis was the site of one of the worst race riots in American history in 1917 when 39 blacks were killed and entire black neighborhoods were burned down. In the second half of the 20th century, whites moved far away from blacks, resulting in the city’s current 97 percent population of black residents.
5. Buffalo
Segregation level: 73.24
New Deal pushed mass homeownership for whites and shut black out; from then on, blacks were seen as a threat to home values. Poor people were denied affordable housing in the suburbs due to limited public transportation, poor communication from housing officials and outright discrimination.
6. Cleveland
Segregation level: 74.14
For white working-class people, their home was their greatest asset and blacks were seen as a threat to that wealth and stability. But housing values have fallen and Cleveland has had a 17 percent population loss since 2000. Blacks are moving into nearby neighborhoods and suburbs, while whites are moving farther away.
7. Detroit
Segregation level: 75.25
In the early 20th century, Detroit’s real estate was so valuable that whites took extreme precautions, such as widespread harassment, violence and property destruction, to ensure that blacks wouldn’t attempt to move out of the crowded ghetto in the city’s Lower East Side. Near the 1980s, white workers moved to the suburbs.
8. Chicago
Segregation level: 76.43
Segregation in Chicago was the result of organized white opposition to the expansion of blacks. Whites were adamant about keeping blacks away since they were competitors for residential areas and jobs. Segregation was reinforced by Richard J. Daley, who used the Interstate Highways Act of 1956 to route expressways through impoverished black neighborhoods, creating a barrier between black and white neighborhoods.
9. New York
Segregation level: 78.04
Back in the 1940s, MetLife refused to rent apartments to blacks in Manhattan’s Stuyvesant Town development. In the 1980s, Yonkers almost went bankrupt fighting an effort to build affordable housing on the city’s white east side.
10. Milwaukee
Segregation level: 81.52
Milwaukee is consistently rated one of the country’s most segregated metro areas. Usually, blacks are concentrated in the inner city, far away from where new jobs are created; but in Milwaukee, the situation is more extreme: 90 percent of the metro area’s black population lives in the city and suburban whites are hostile to building any type of public transit that would connect city people to suburban jobs. The city’s segregated mentality was certainly evident in the 2008 presidential election, when city-dwellers supported Obama 31 points more than suburbanites.


